ML-K-mean-Cluster

Introduction to K-mean Clustering
In Chinese, we usually say “物以类聚”, which means somethings in the same class can be grouped together based on their similar attributes. For example, when we group different types of fruit, like apple, cherry, blackberry, together based on their color, then we can group apple and cherry into the same class and the blackberry into another class.
In K-mean clustering, it uses the same idea, by assigning different data points to the same cluster center based on the distance between data point and different cluster centers. By grouping data together simply, we can explore the similarity among data points and potential data pattern, which can help us analyze the internal features between data.
Note that K-mean clustering is an unsupervised, non-parameter learning method, since it doesn’t use labels created by human or any numerical parameters/ weights like linear, logistic regression to estimate the distribution of data.
How K-mean Clustering works?
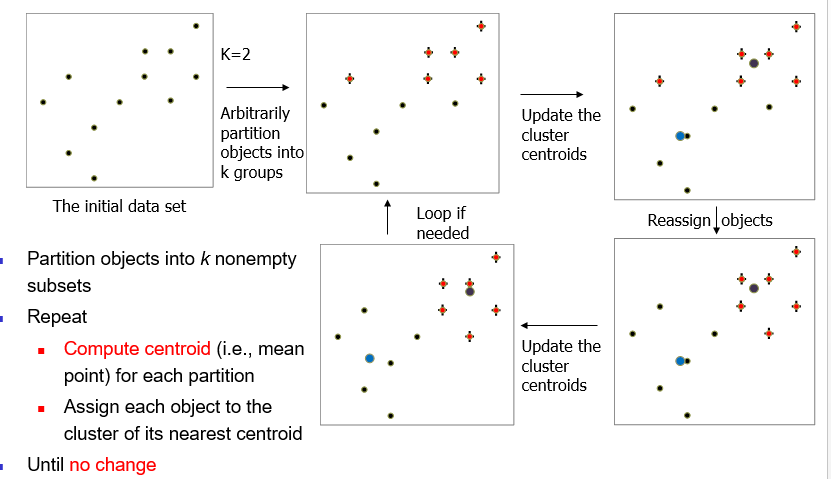
The steps in K-Mean-Clustering are following:
- Pick the number of clusters K
- Randomly assign K cluster centers in feature space
- In the feature space, each data point is assigned to the cluster, whose center is closest to this point, based on distance measurement (Usually Euclidean Distance)
- In each cluster, re-compute and update the center/mean value of this cluster based on data points in the cluster.
- Repeat Step 3 to 4 until the cluster of each data point doesn’t change, or called Converged.
Here is an image to demonstrate the process of K-mean clustering.

Distributed Version of K-mean Clustering
As K-mean clustering is a simple straight-forward unsupervised learning method, it can be extended to distributed version easily.
In distributed version of K-mean Clustering, we have:
- Partition big data data points evenly into n processes.
- Mapper Function:
Each process uses its local data points to do K-mean clustering. Each process has the same K value - Shuffle / Sort K cluster centers from each process. Then we have K * n cluster centers
- Reducer Function:
In the Kn cluster center points, we do K-mean clustering again to find K cluster centers of Kn center points - Send the K cluster centers found in step 4 back to each process (then each process has the same K centers) and repeat step 2 to 5 until K centers don’t move (Converge)
Properties of K-mean Clustering
Although K-Mean Clustering is very easy to compute, it has different advantages and disadvantages.
Advantage
- Computing mean of data is easy and fast
- Can explore potential similarity on low-dimensional data points
Disadvantage
Need to specify the K value and we don’t know which K is the best.
Cluster Pattern can be affected by scale of data, Since K-mean clustering is distance-based method. If different attributes are not in same scale, the cluster pattern will be distorted and some data points may be assigned to wrong cluster
So K-mean Cluster need normalization of dataCluster is Sensitive to outlier data point (data outside the normal range of cluster) and cluster will shift a lot when computing mean.
For example:
I have a dataset like [-100, -1, 0, 1, 5,6,7], where -100 is a outlier point as it is pretty far away from other data points. If I have two cluster centers 0, 8, then [-100, -1, 0, 1] will belong to cluster 0 and [5,6, 7] belongs to cluster 8.
When I update the centers of two clusters, they become (-100-1+0+1) / 4 = -25, and (5+6+7)/3 = 6. We can see that -25 this center is actually very far away from data points (-1, 0, 1) due to outlier -100. In the next assignment of points, all (-1, 0, 1) points will be assigned to another cluster based on distance. Hence the clustering pattern will be distorted.K-mean Clustering needs to store all data points to compute. It can lead to large space complexity when handling large data.
K-mean Clustering can detect Convex patterns only, such as circle, retangle, triangle. But for non-convex patterns, like U-shape, V-shape, patterns, it can not make cluster correctly.
Not work directly in high dimensional data and unstructured data like image.
When to Use
- When we want to simply visualize the data distribution, we can use PCA, t-SNE to reduce dimension of data and use K-mean clustering to visualize them
- When the data is in low dimension
Some extension of clustering
- K-medoid clustering: using median rather than mean to update clustring
- Hierarchical Clustering: use distance matrix as clustering criteria. Without the need of value K but need terminal state
- BIRCH
- CF-Tree: tree-based hierarchical clustering
- Density clustering
- DBSCAN
- OPTICS
- …